Whether it's good, bad, or ugly, or a combination of all of those things, it's baseball. It might not be the baseball we wanted, but it is the baseball that 2020 demands. Happy baseballing, y'all. Read more »
Whatever it looks like when the season actually starts, there aren't really any winners in this deal. The animus of these negotiations will not be forgotten by either side and the likelihood of a breakdown in future negotiations cant be understated at this point. Read more »
There's been a lot of talk about baseball "healing the country," from political figures and the commissioner himself. While that's a romantic notion, it's pretty much garbage. Read more »
Just because there's other, more important things going down, that doesn't mean we should ignore the fact that MLB has basically failed to establish clear standards of accountability when it comes to enforcing its rules. Read more »
On what else happened in the AL offseason beyond Boston's trade of Mookie Betts, the Astros' sign stealing scandal, and the Yankees signing Gerrit Cole. Read more »
A virus is an unthinking nemesis that doesn't care who it infects, be it a multimillionaire superstar in the MLB or someone selling you a hotdog. Read more »
No position carries more volatility in baseball than relief pitcher. Even players within tier 1 have some risk of losing their groove, and thus their job as the team's closer. Read more »
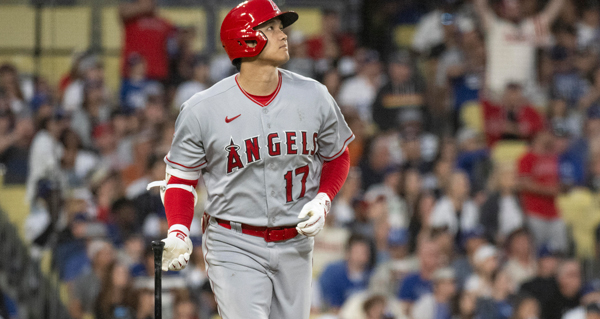
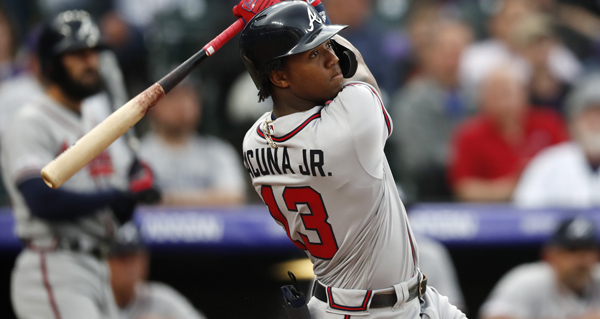
The top five fantasy baseball players, at any position, are outfielders in Mike Trout, Ronald Acuna, Christian Yelich, Cody Bellinger, Mookie Betts. Read more »
The catcher position should be treated the same way as kickers in fantasy football... punt! The top catchers are always overdrafted in leagues, and injuries hit the position more so than any of the other hitters. Read more »
It's very hard to go wrong at shortstop this year due to the unprecedented depth at the position beginning with Francisco Lindor and then having a player of Corey Seager's talent all the way in tier 4. Read more »
First base doesn't have the oomph that it used to have back in fantasy yore, but Cody Bellinger and Freddie Freeman are top picks regardless of position. Read more »
The Dodgers not only acquired one of the best players in baseball, but managed to hold onto their top prospects and may have remained under the luxury tax/faux salary cap at the same time. Read more »